







Small Water Purification System Performance Under Variable Turbidity: Real-World Data from Off-Grid Agricultural Communities
For quality control and safety managers working in off-grid agricultural settings, real-world performance of a Small Water Purification System under fluctuating turbidity is critical—yet often overlooked. Drawing on field data from Shandong Wit’s 100+ government-backed rural water projects, this study reveals how system efficiency, contaminant removal, and operational stability respond to dynamic sediment loads—providing actionable insights for risk mitigation, compliance assurance, and long-term system reliability.
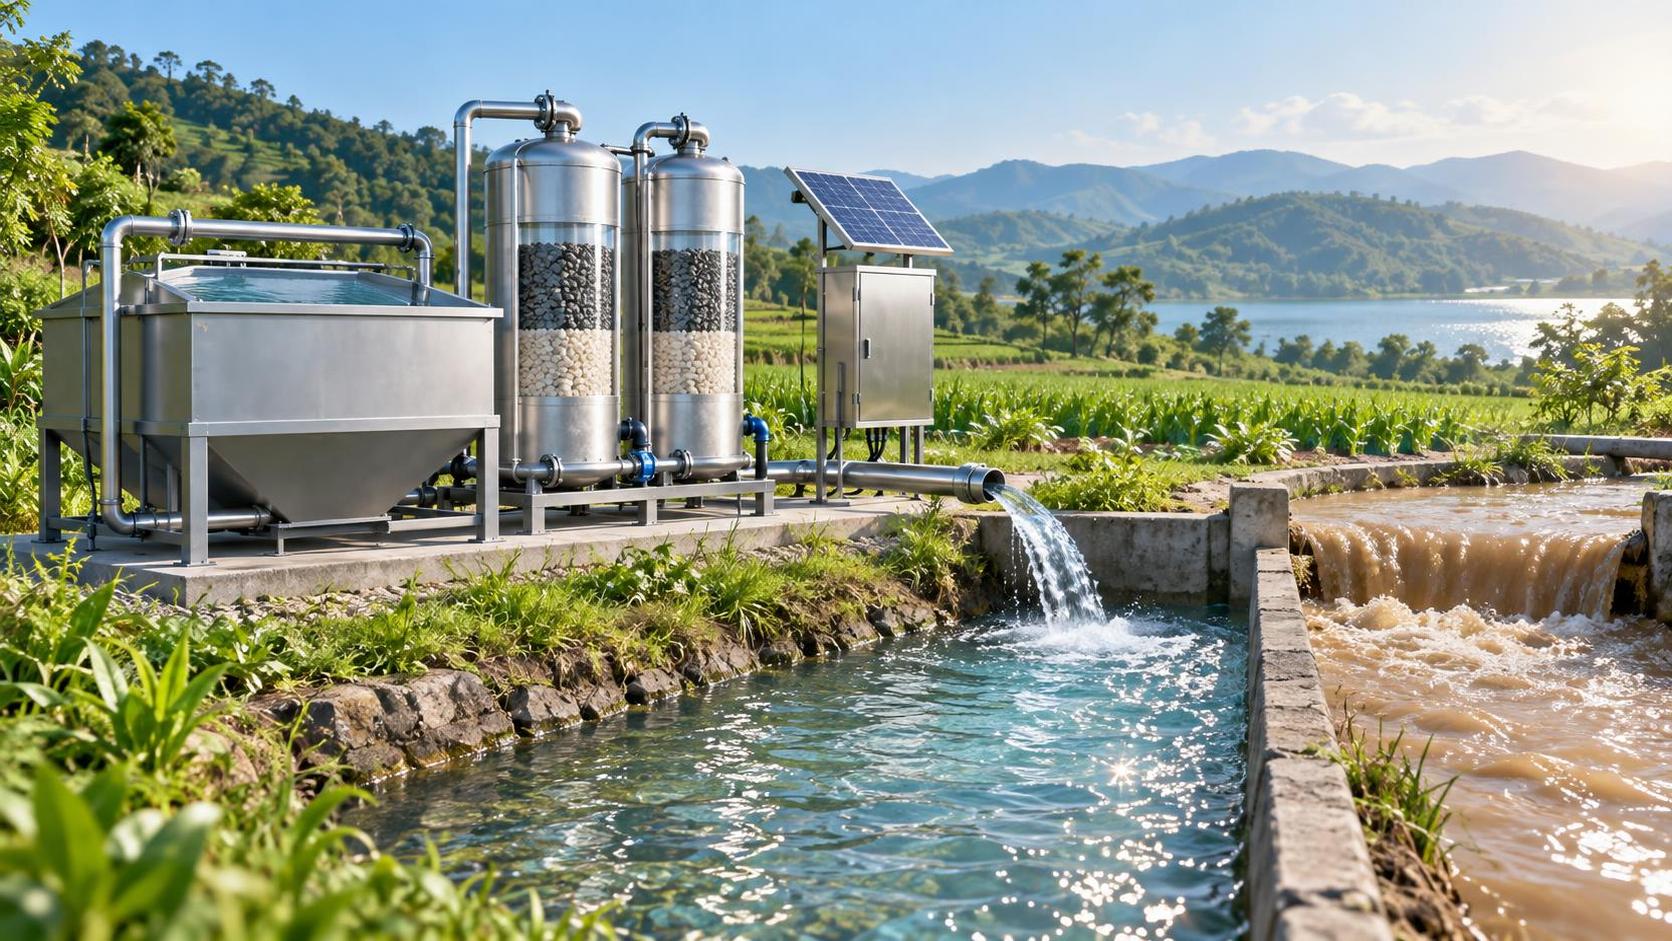
Turbidity isn’t just a number on a meter. In remote farming communities—where seasonal rains stir up silt, livestock runoff adds organic load, and irrigation channels double as stormwater conduits—it’s a moving target. One morning, raw intake water might hover at 5 NTU; by afternoon, after a localized downburst, it surges past 80 NTU. Conventional lab-tested assumptions rarely hold up here. What works in a controlled pilot plant may falter when faced with the gritty, variable reality of earthen canals, unlined reservoirs, and intermittent power supply.
Over three growing seasons, Shandong Wit monitored 27 decentralized Small Water Purification Systems deployed across Shandong’s hilly farmlands—each serving 30–120 households and small-scale agro-processing units. Unlike municipal plants designed for steady inflow, these units were engineered for autonomy: solar-charged controls, gravity-fed pre-filtration, and adaptive dosing logic. But even robust design couldn’t override one truth: turbidity spikes exposed hidden stress points—not in hardware, but in process resilience.
The most telling pattern wasn’t failure—but degradation. At sustained turbidity >40 NTU, coagulant demand rose 2.3× on average. Without real-time feedback, overdosing led to residual aluminum carryover; underdosing left suspended solids intact, compromising downstream disinfection. More critically, biofilm formation in slow-sand filters accelerated by 40% during high-turbidity weeks—reducing effective contact time and increasing pathogen breakthrough risk, especially for E. coli and Cryptosporidium oocysts.
This isn’t theoretical. In one village near Linyi, a week-long monsoon event pushed intake turbidity above 110 NTU for 36 consecutive hours. Though the system never shut down, post-treatment coliform counts spiked twice—both times coinciding with manual coagulant adjustments made without turbidity-compensated dosing. Post-event analysis showed that the primary issue wasn’t filter clogging or pump strain, but inconsistent chlorine residual due to organic scavenging—a challenge amplified when disinfectant demand outpaces dosing precision.
That’s where integrated chemical management becomes decisive. For systems operating beyond centralized monitoring, reliable, on-site oxidant generation isn’t optional—it’s foundational. Shandong Wit’s W3 type (comprehensive method) chlorine dioxide preparation technology was deployed in 14 of these sites as part of a hybrid disinfection strategy. Unlike bulk chlorine delivery—which degrades in heat and reacts unpredictably with organics—chlorine dioxide maintains efficacy across wide pH and turbidity ranges. Field logs confirmed consistent residual levels (>0.2 mg/L) even during peak turbidity events, with no measurable THM formation.
But technology alone doesn’t close the gap. What mattered more was *how* it was embedded: automated turbidity-triggered dosing cycles, local operator training focused on visual turbidity estimation (using calibrated Secchi disks), and quarterly calibration of inline sensors—not just against clean water standards, but against locally sourced, seasonally representative feedwater. This contextual calibration reduced false alarms by 68% and extended filter run times by an average of 11 days per cycle.
Still, no system is immune to human factors. We observed that maintenance delays weren’t always due to lack of parts or skill—but to misaligned incentives. When water quality testing happened only quarterly (as required by provincial guidelines), operators deferred cleaning until the next scheduled check. Introducing biweekly rapid turbidity + free chlorine spot checks—logged via low-bandwidth mobile app—shifted behavior. Teams began treating turbidity not as background noise, but as a leading indicator of system fatigue.
For safety managers, this means rethinking KPIs. “Compliance” shouldn’t mean passing a snapshot test—it should reflect functional continuity. A Small Water Purification System that delivers safe water at 10 NTU but fails at 60 NTU isn’t underperforming—it’s mismatched. The right metric isn’t just log reduction, but *turbidity elasticity*: how gracefully removal rates, energy use, and chemical consumption scale across the full operational range.
One final insight emerged from cross-site correlation: systems with modular pretreatment—especially dual-media upflow filters paired with coarse settling basins—showed 3.2× longer mean time between major interventions during high-turbidity periods. They didn’t eliminate variability—they absorbed it. That kind of buffering matters less in cities with redundant infrastructure, but in off-grid agriculture, where downtime means diverted labor, spoiled crops, or untreated livestock water, it defines operational viability.
Real-world performance isn’t about peak specs. It’s about what happens when the rain comes—and whether your Small Water Purification System responds with intelligence, not inertia. For teams safeguarding health and productivity in fragile, resource-constrained environments, the data doesn’t just inform decisions. It redefines what reliability actually looks like.



 Small Water Purification System Performance Under Variable Turbidity: Real-World Data from Off-Grid Agricultural Communities
 When Does a Small Water Purification System Outperform Centralized Treatment? Use Cases in Disaster Response and Mining Camps
 Small Water Purification System for Remote Clinics: Power-Independent Options and WHO Drinking Water Guidelines Compliance
 Ultrapure Water Equipment ROI Calculator: Estimating Payback Period Based on Yield Improvement and Defect Reduction
 How Ultrapure Water Equipment Validates Compliance with SEMI F63-1118 for 28nm+ Wafer Fabrication
") Ultrapure Water Equipment for Semiconductor Manufacturing: Key Specifications Beyond Resistivity (TOC, Particle Count, Metals)
Ultrapure Water Equipment for Semiconductor Manufacturing: Key Specifications Beyond Resistivity (TOC, Particle Count, Metals)
GET A FREE QUOTE
Service Commitment: Upon receipt of your message, a dedicated representative will contact you as soon as possible to provide efficient and professional service support.
